
Looking For Election Night Results? Here’s All You Need
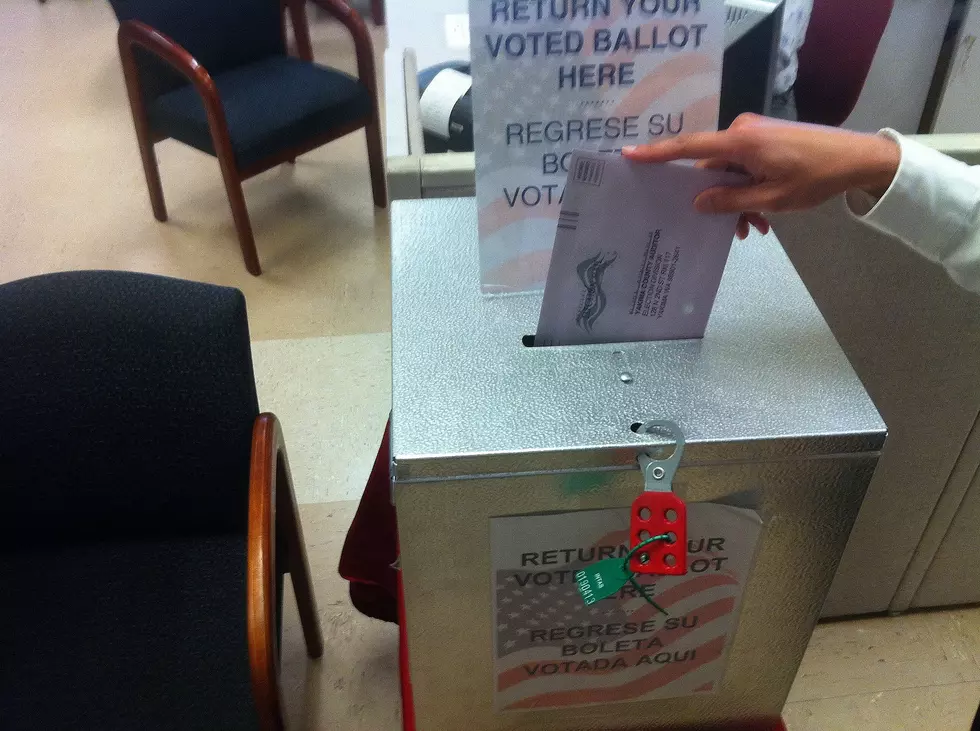
Tuesday was election day in Washington State. Depending upon where you live it was a busy ballot with lots of choices for voters. Others didn't have much on the ballot. 16% of more than 128,000 ballots sent out were counted on Tuesday. Auditor Charles Ross expects a 30% turnout when the counting is over. More ballots will be counted Wednesday afternoon and everyday until the election is certified later this month.
If you are a voter in the largest city in the valley, Yakima you may have been voting on three Yakima City Council Positions;
District 1 Yakima City Council
Dulce Gutierrez 36.92% 182 votes
Leo Roy 62.27% 307 votes
District 5 Yakima City Council
Soneya Lund 40.04% 553 votes
Rick Glenn 59.29% 967 votes
District 7 Yakima City Council
Holly Cousins 47.12% 860 votes
Reedy Berg 52.33% 955 votes
City of Selah Mayor
Russel Carlson 44.34% 458 votes
Roger Bell 54.7% 565 votes
YAKIMA SCHOOL DISTRICT NO. 7 Director, Position 3
Colleen Sheahan 43.4% 2156 votes
Norm Walker 56.04% 2784 votes
YAKIMA SCHOOL DISTRICT NO. 7 Director, Position 4
Donald J. Davis, Jr. 32.7% 1607 votes
Raymond Navarro, Jr. 66.81% 3283 votes
Yakima School District No. 7
Director, Position 5
Martha Rice 54.89% 2699 votes
Jennifer Hawks Conright 44.36% 2181 votes
West Valley School District No. 208
Director, District 1
Joel Hede 62.99% 3060 votes
Marc Anthony Cisneros Cervantes 36.5% 1773 votes
West Valley School District No. 208
Director District 4
James Kephart 57.81% 2831 votes
Mark Mochel 41.94% 2054 votes
West Valley School District No. 208
Director District 5
Steve Wolcott 55.42% 2747 votes
Dave Jaeger 44.38% 2200
For all other election night results;
https://results.vote.wa.gov/results/20231107/yakima/
MORE TOP STORIES FROM LANCE:
- Yakima Man Lucky To Be Alive After Near Cougar Attack
- The Top 3 Preferred Ice Cream Flavors in Washington State
- 3 Top Counties in WA Where People Are Overdosing and Dying
25 True Crime Locations: What Do They Look Like Today?
READ ON: See the States Where People Live the Longest
Gallery Credit: Hannah Lang
LOOK: 50 cozy towns to visit this winter
Gallery Credit: Laura Ratliff

More From 94.5 KATS

